VIGOR
Paper
VIGOR: Interactive Visual Exploration of Graph Query Results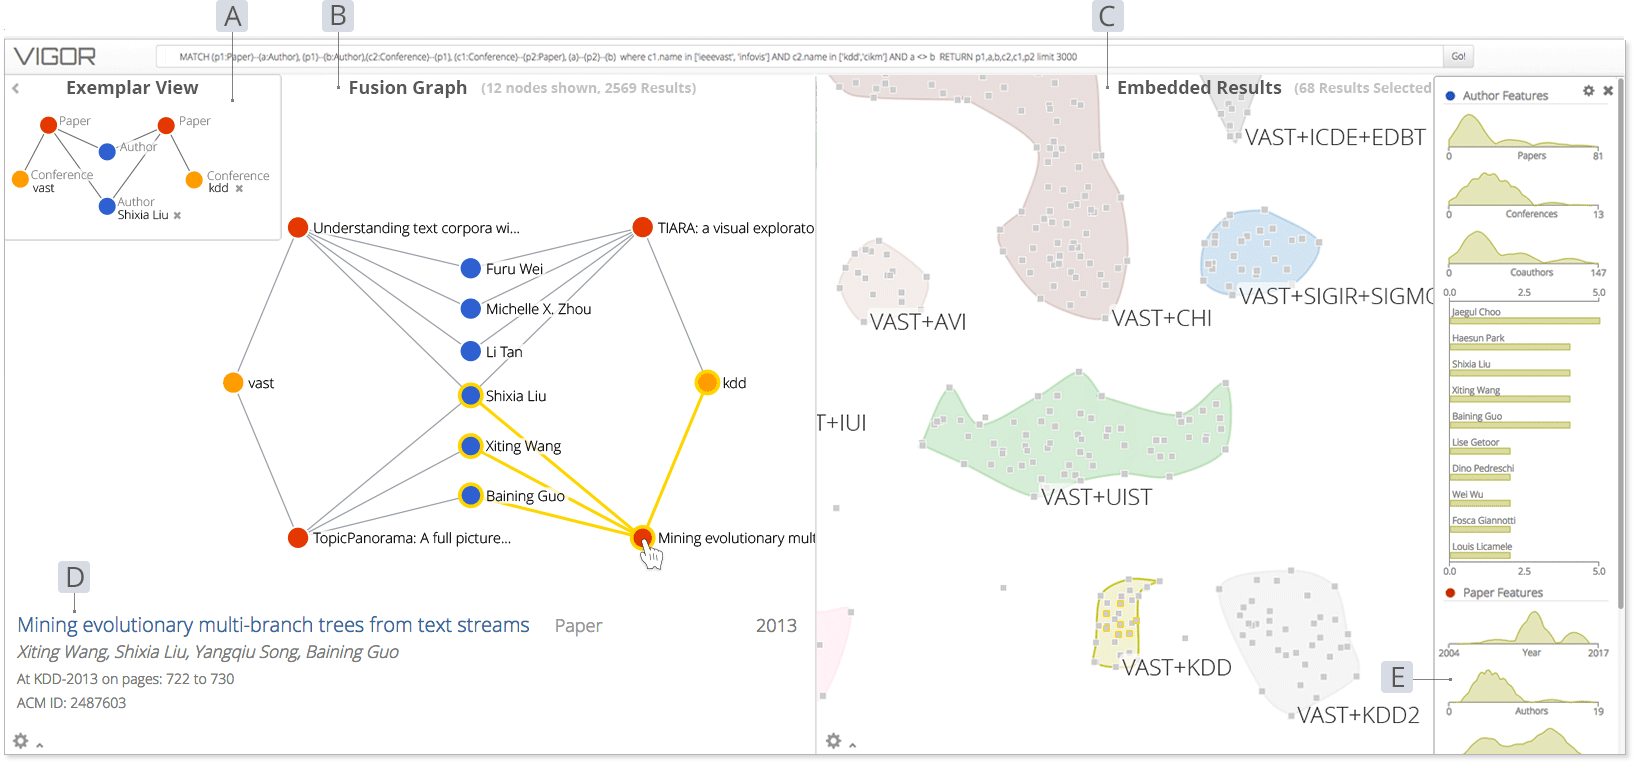
A screenshot of VIGOR showing an analyst exploring a DBLP co-authorship network, looking for researchers who have co-authored papers at the VAST and KDD conferences. (A) The Exemplar View visualizes the query, and (B) the Fusion Graph shows the induced graph formed by joining all query matches. Picking constant node values (e.g., Shixia) in the Exemplar View filters the Fusion Graph. (C) Hovering over a node shows its details. (D) The Subgraph Embedding embeds each match as a point in lower-dimensional space and clusters them to allow analysts to see patterns and outliers. (E) The Feature Explorer summarizes each cluster’s feature distributions
Abstract
Finding patterns in graphs has become a vital challenge in many domains from biological systems, network security, to finance (e.g., finding money laundering rings of bankers and business owners). While there is significant interest in graph databases and querying techniques, less research has focused on helping analysts make sense of underlying patterns within a group of subgraph results. Visualizing graph query results is challenging, requiring effective summarization of a large number of subgraphs, each having potentially shared node-values, rich node features, and flexible structure across queries. We present VIGOR, a novel interactive visual analytics system, for exploring and making sense of query results. VIGOR uses multiple coordinated views, leveraging different data representations and organizations to streamline analysts sensemaking process. VIGOR contributes: (1) an exemplar-based interaction technique, where an analyst starts with a specific result and relaxes constraints to find other similar results or starts with only the structure (i.e., without node value constraints), and adds constraints to narrow in on specific results; and (2) a novel feature-aware subgraph result summarization. Through a collaboration with Symantec, we demonstrate how VIGOR helps tackle real-world problems through the discovery of security blindspots in a cybersecurity dataset with over 11,000 incidents. We also evaluate VIGOR with a within-subjects study, demonstrating VIGOR’s ease of use over a leading graph database management system, and its ability to help analysts understand their results at higher speed and make fewer errors. Materials
PDFBibTeXVideo Video